
Using Dashboards to Track Leads: A Practical Guide
Learn how to use Talkty’s Overview and Reports to track incoming leads, review the sales funnel, and understand team and ad performance.
By Emily Carter · · 5 min read ·

Using dashboards to track leads helps you see what is happening across your sales pipeline without relying on scattered notes. In Talkty, the Overview and Reports bring together lead, funnel, team, and marketing information so you can monitor activity and decide which individual opportunities to review next.
What you can track in Talkty
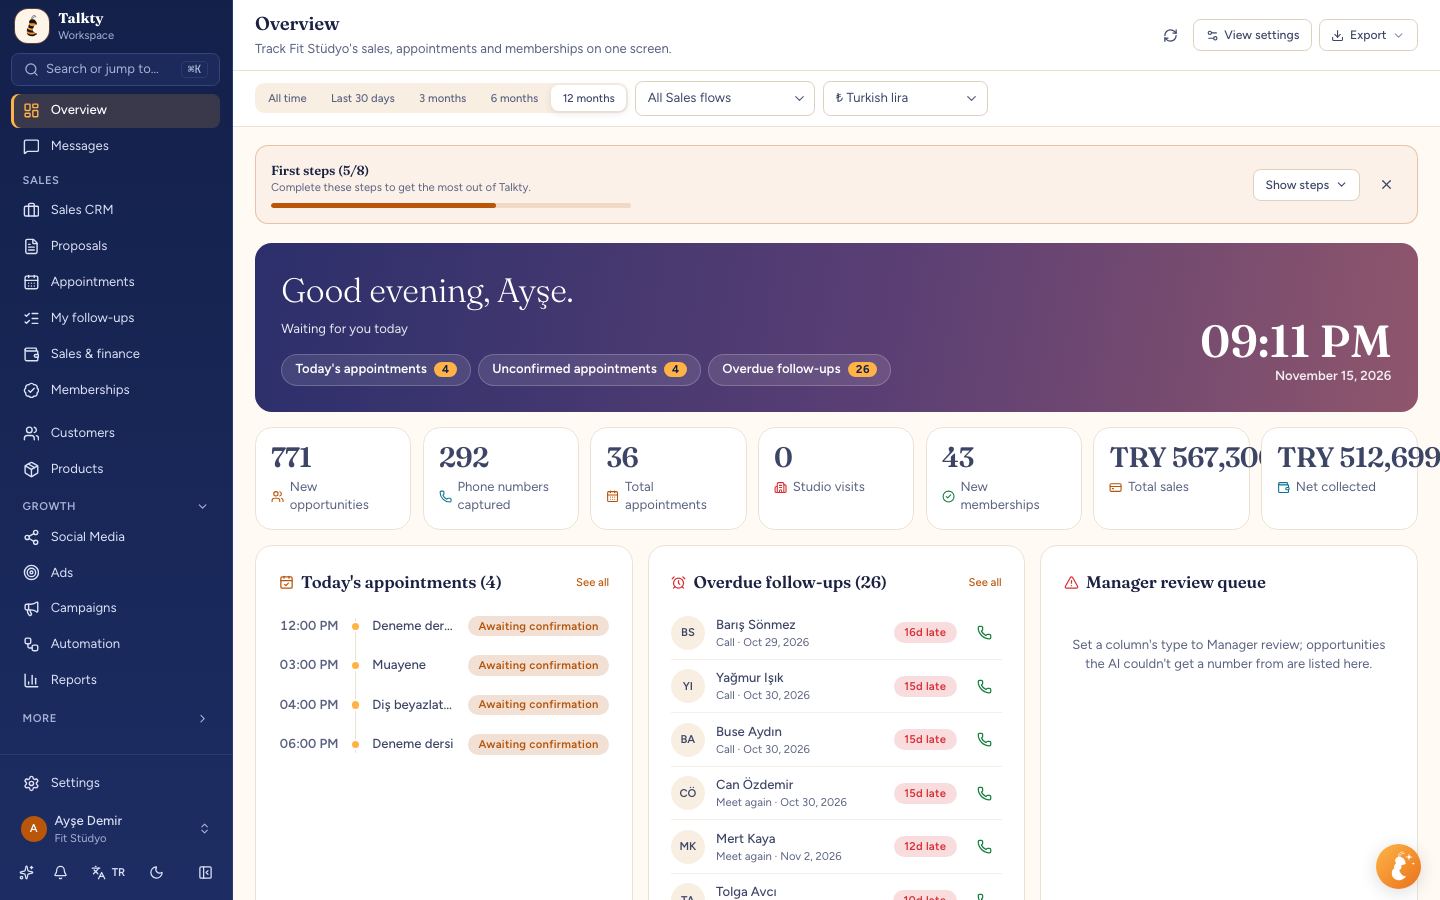
Talkty’s Overview shows incoming leads, the sales funnel, rep performance, response times, a financial summary, and recent sales. Its period picker changes the date range for the main figures, funnel, rep performance, financial summary, and recent sales. You can choose All time, Last 30 days, 3 months, 6 months, or 12 months. Today’s appointments, overdue follow-ups, review queue, membership renewals, and today’s payments are not changed by that period selection.
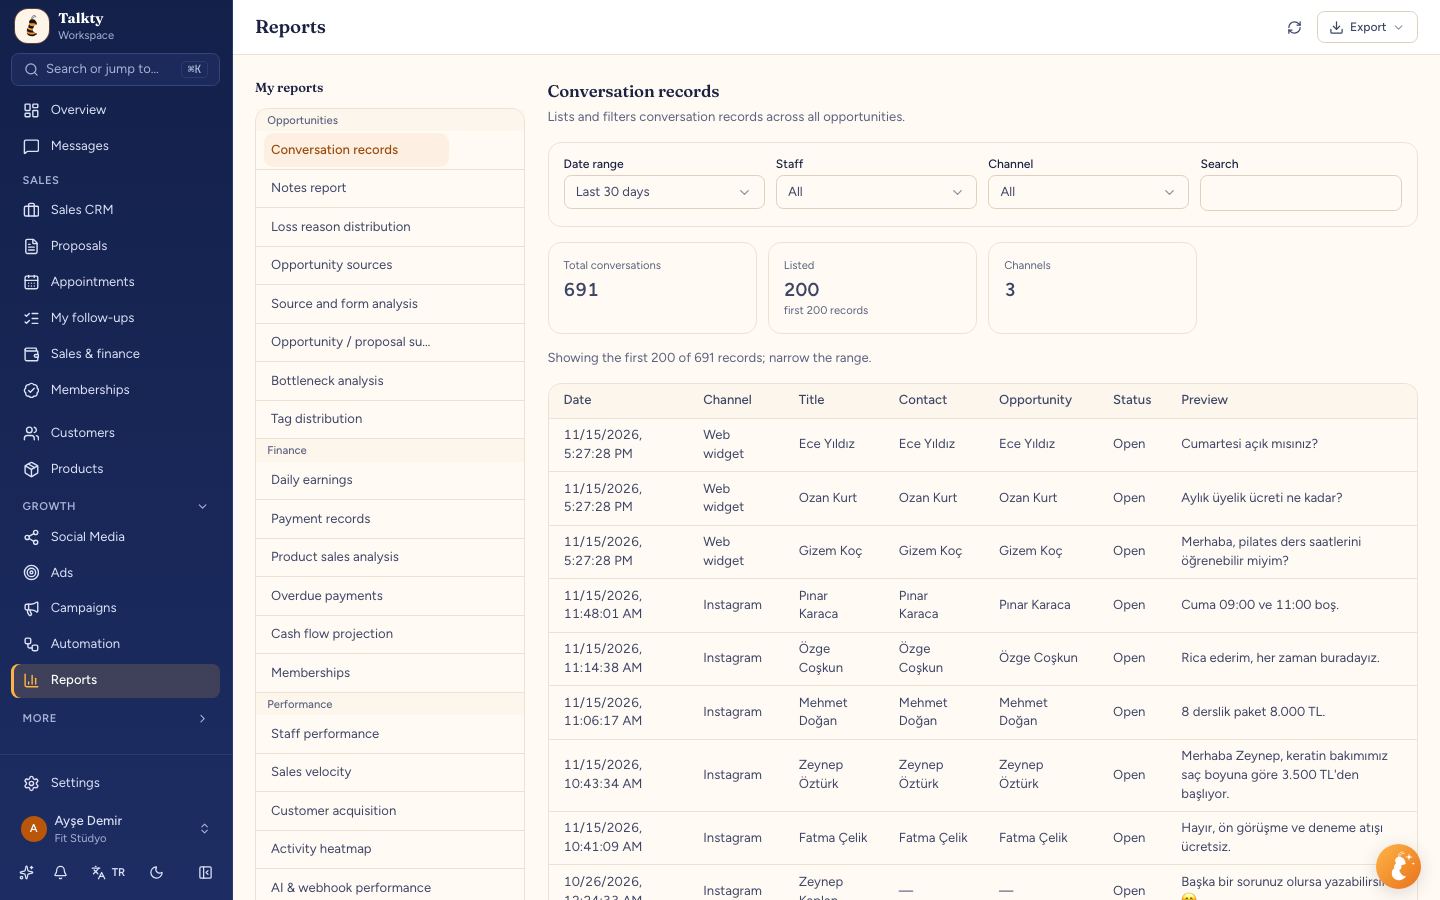
Reports provides more detailed views for sales, messaging, marketing, appointments, finance, and customers. Use the Overview to monitor activity, then open the relevant report when you need to investigate a particular source, campaign, or result.
Step by step: use the Overview to monitor leads
- Open Overview. Start with the dashboard’s main view to see incoming leads, the sales funnel, rep performance, response times, and recent sales.
- Choose a period. Use the period picker to set the time range for the main figures. Select All time to include every record, or choose a shorter period for a focused review.
- Review the funnel. Check how opportunities are distributed across the sales funnel. The dashboard helps you monitor where opportunities sit; it does not itself carry out follow-up actions.
- Check rep performance and response times. Review these sections to understand team activity. Note that Overview sales rep performance credits a sale to the person who recorded it in Finance. The Staff performance report credits revenue to the opportunity card owner, so the two views can show different figures for the same person.
- Check follow-up items. Overdue follow-ups and today’s appointments are not affected by the selected period. Review them as part of your daily monitoring.
Follow a lead from its source to a sale
To investigate where leads came from, open Reports and use Source and form analysis. The search box lets you break results down by channel, source, medium, campaign (UTM), or ad.
Use the ad breakdown to connect lead sources with sales. For lead-form ads, the report shows the ad name; for messaging ads, it shows the ad headline. In a creative test, the ad name can include the angle. This helps you compare results by the ad or angle associated with an opportunity.
Talkty defines revenue in these reports as the value of won opportunities, excluding records in the trash. If a sale is cancelled or refunded in Finance, it is not counted as revenue and the opportunity counts as lost. Keep this definition in mind when comparing lead activity with sales results.
Review ad performance and ROAS
In Reports, Ad performance places campaign results alongside CRM outcomes. When you select a date range, Meta figures represent the results Meta returns for those dates. Campaigns that spent during the range or were created in it are listed, while CRM lead counts reflect leads that arrived during the selected range. With All time, or when Meta data cannot be read, campaign figures are lifetime totals.
The report’s CRM results include leads received through the ad form and won sales from those leads. ROAS is revenue from ads divided by spend. To inspect an individual campaign in more detail, open its ad report for a per-campaign daily breakdown.
Talkty also supports Google Ads reporting when a Google Ads account is connected. The Google Ads figures include spend, clicks, and Google Ads conversions. Today’s Google data may lag by a few hours. The campaign list can show spend, impressions, clicks, Google Ads conversions, leads received, and CRM sales; the metrics shown depend on the data available for the campaign.
CRM sales and ROAS are based on won opportunities attributed to Google ad clicks. Matching uses the Google click ID captured by the web tracking code; if a campaign name arrived as utm_campaign, that can also be used. Google Ads figures are fetched when you connect, each morning, and when you press Refresh. The same figures also appear in Reports › Ad performance next to Meta campaigns.
Use the CRM to act on dashboard findings
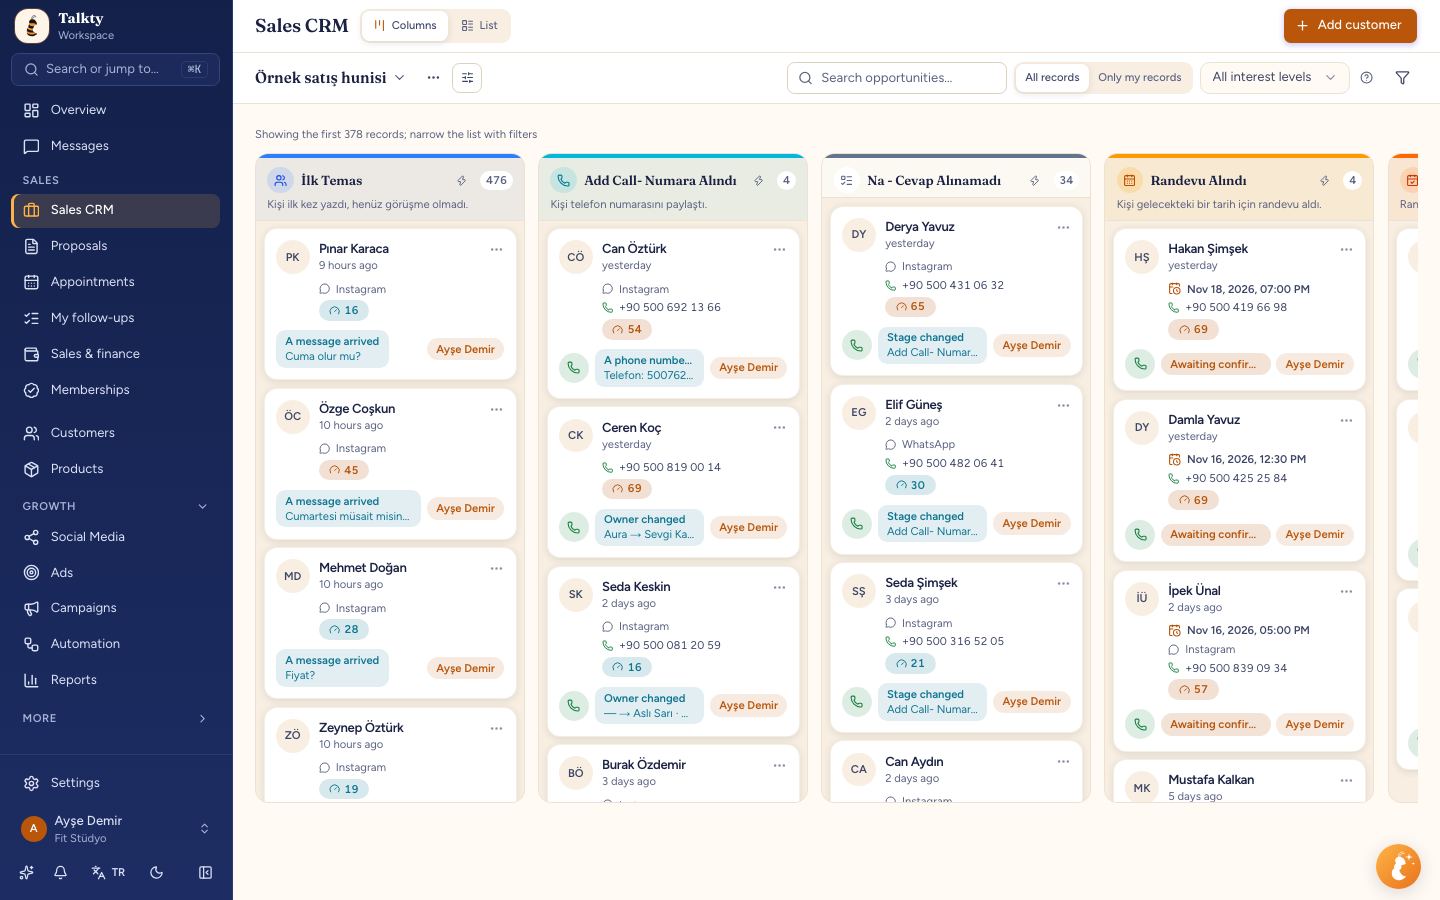
The dashboard is for monitoring lead activity. When you decide an individual opportunity needs attention, open the Sales CRM to manage that record. Each customer is represented by a card on a drag-and-drop board. The CRM includes follow-up plans, reminders, and a dated activity history, helping your team keep track of what has happened and what needs attention.
You can also assign and tag conversations in the shared inbox, which brings WhatsApp, Instagram, Messenger, and web chat into one list. This helps keep conversations organized while your team manages opportunities in the CRM. For more on setting up repeatable follow-up work, see Building Workflows with Visual Automation Using Talkty.
Turn dashboard findings into a review routine
Use a simple monitoring process:
- Start in Overview and choose the period that fits the question you are asking.
- Check the funnel, response times, and overdue follow-ups to identify items for review.
- Open Source and form analysis when you need to understand where opportunities came from.
- Use Ad performance to compare campaign activity with CRM leads and won sales.
- Open the CRM to review individual opportunity cards, follow-up plans, reminders, and activity history.
Talkty’s visual flow builder can automate repetitive work using flows triggered by incoming messages, opportunity changes, or a schedule. Available templates include a new-lead follow-up and a follow-up for opportunities that have not moved. These are automation options to configure separately; reviewing the dashboard does not itself trigger a follow-up. For a practical overview of AI responses to customer questions, read Using AI for Customer Support 24/7: A Practical Guide.
Summary
Using dashboards to track leads in Talkty starts with the Overview: choose a period and monitor the funnel, team activity, and follow-up items. Use Reports to investigate sources, campaigns, and ad results. When an individual opportunity needs action, manage it in the CRM. Understanding how each report defines revenue and attributes performance helps you interpret the numbers consistently.
Frequently asked questions
- What lead information does Talkty show on the Overview?
- The Overview shows incoming leads, the sales funnel, rep performance, response times, a financial summary, and recent sales.
- Which date ranges can I choose in the Overview?
- The period picker offers All time, Last 30 days, 3 months, 6 months, and 12 months. Today’s appointments, overdue follow-ups, review queue, membership renewals, and today’s payments are not affected by the selected period.
- How does Talkty calculate ROAS in Ad performance?
- ROAS is revenue from ads divided by spend. The CRM results include leads received through ad forms and won sales from those leads.
- Why might Overview and Staff performance show different revenue for a team member?
- Overview credits sales to the person who recorded the sale in Finance. Staff performance credits revenue to the owner of the opportunity card.
- Where can I see how leads came in?
- Open Reports and use Source and form analysis. You can break results down by channel, source, medium, campaign (UTM), or ad.
Emily Carter