
Reports and analytics
Reports
Sales, messaging, marketing (ads, social, campaigns), appointment, finance and customer reports; scheduled report emails.
Reports offers dozens of ready reports on your business's performance.
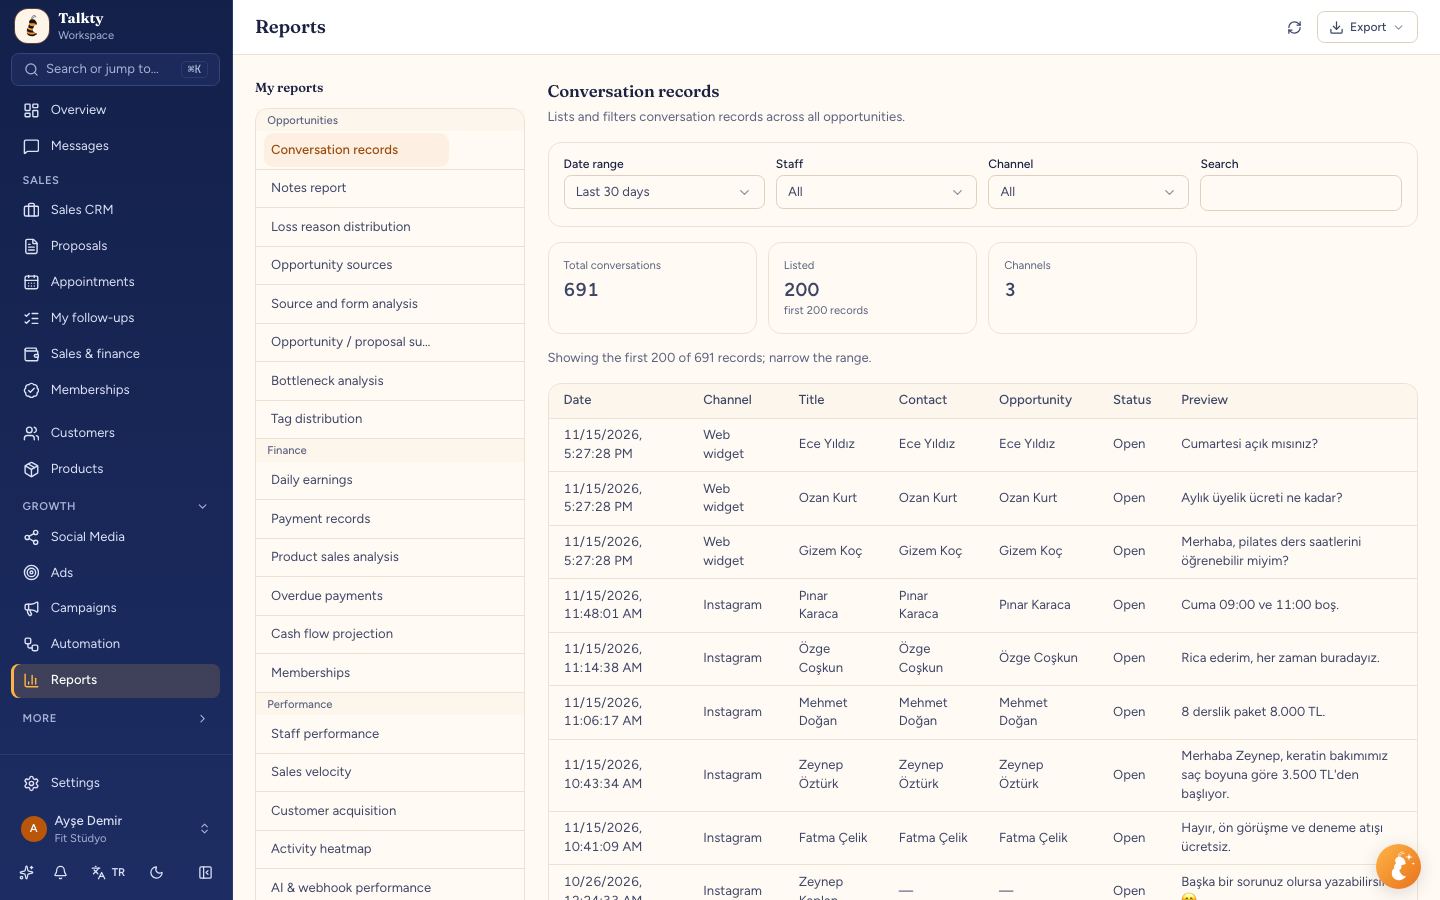
Report types
- Sales: sales funnel and stage-to-stage conversion, sales velocity, bottleneck analysis (stuck cards), won/lost, loss reasons, lead sources, rep performance.
- Messaging: first response time, channel breakdown, AI vs manual reply share, AI quality and AI reply review (below).
- Marketing: Ad performance (spend, clicks, leads, sales from ads and ROAS for Meta and Google ads; Google rows cover the last 30 days), WhatsApp and email campaigns, Group broadcasts, Social media posts (published, queued, failed and pending approval per account), Instagram comment → DM (comments and DMs sent per rule), Visitor sources (where site visitors came from, their UTM campaign and content; how many submitted a form, were identified and became deals), email domain health.
- Appointments and goals: Appointments (status breakdown and no-show rate), AI appointments → sales (customers who showed up, cards won and revenue from appointments booked by AI, next to those booked by the team and sales without an appointment), Goal progress.
- Finance: daily earnings, cash flow, overdue payments, product sales, Memberships (active, frozen, cancelled and ending-in-30-days memberships per package).
- Leads: interest score distribution.
- Customers: repeat customers, churn risk, RFM and cohort analyses, cross-selling.
- Usage: token usage.
AI quality
The AI quality report shows how conversations AI replied to actually ended. AI having replied is not counted as success by itself:
- AI replied: a conversation with at least one AI reply. An automation's quick message does not count as AI.
- AI resolution rate: of AI-replied conversations that are closed, the share that closed with no human reply and no handover. Conversations still open are not in the rate; they are counted separately.
- Handed over: the share of conversations AI handed over to your team.
- Human reply after AI: the share where someone on your team also wrote after the AI reply.
- AI resolution time: the median time from the first customer message to closing; the human resolution time is shown next to it.
- Reply failed: attempts where AI could not produce a reply or the reply could not be delivered.
- Action success: of the actions AI ran (appointment, card, handover…), the share that actually succeeded.
- No answer found (indicator): the AI reply reads like "I don't know / I'll pass it to the team". It is not an exact measure; it is a hint to add these questions to your knowledge base.
The table gives the same measures per channel. Separate measurement of AI replies started with this version; the report shows the start date, and in older conversations AI replies count as human replies.
The AI reply review report lists flagged attempts (no answer found, failed action, reply failed) next to the customer's question and the AI reply. Fix wrong or missing answers by adding them to the knowledge base.
How the numbers are calculated
The period picker on the Overview (All time · Last 30 days · 3 months · 6 months · 12 months) changes the numbers at the top, the sales funnel, rep performance, the financial summary and recent sales; All time counts every record with no start date. Today's appointments, overdue follow-ups, the review queue, membership renewals and today's payments don't depend on the period.
Reports and the Overview count the same thing the same way:
- Revenue: the value of won opportunities (trash excluded). An opportunity whose sale was cancelled or refunded in Finance is not revenue and counts as lost. Opportunity sources, Source and form analysis, Opportunity / proposal summary, Period comparison and Staff performance use this definition.
- Staff performance credits revenue to the card owner. Sales rep performance on the Overview credits the sales amount to the person who made the sale in Finance, so the two screens can show different figures for the same person.
- Product sales analysis: the Won opportunities count and the table rows come from the same opportunities; an opportunity whose sale was cancelled or refunded is in neither. With the Source filter you see only products from your store connection (Store) or those added manually (Added manually; free-text lines not picked from the catalogue included); while the filter is on, the totals-difference note isn't shown.
- Collections: counted by the date the payment was received; a refund is deducted on the date it was made. Net collected on the Overview also deducts commission and matches net collected in Finance › Report.
- Daily earnings: answers "what did I earn today?". The Day field opens on today; you can pick another day. Net collected is the payments received that day minus commission and refunds made that day (the same definition as the Overview), with the change against the previous day. New sales are sales opened that day and not cancelled; Refunds / cancellations shows the amount refunded that day and the number of cancelled sales. Boxes break collections down by payment method, the table lists the day's payments and refunds by time (a payment entered with a date only has no time and shows "—"), and the chart shows net collections for the last 30 days.
- Source and form analysis: pick the breakdown in the search box:
channel(default),source,medium,campaign(UTM) orad. The ad breakdown shows the ad name for lead forms (in a creative test "… · Angle: Problem") and the ad headline for messaging ads, so you see which ad or angle turned into sales. - Ad performance: When a date range is chosen, Meta figures are the real numbers for those dates (read from Meta at that moment). Campaigns that spent in the range or were created in it are listed, and the CRM columns count leads that came in during the range. With All, or if Meta can't be read, the figures are lifetime totals for the campaign. Leads in CRM are people who reached Talkty through the ad form; Won sales and Revenue from ads are those leads' won cards. ROAS = revenue from ads ÷ spend. Per-campaign daily breakdown is in the ad report.
- Visitor sources: each row is source +
utm_campaign+utm_contentfrom the first visit (put a differentutm_contentin each ad's link to see it per ad). Submitted a form counts visitors who sent a form on the site or identified themselves (those who reached the sign-up form). The chart totals by source only. - Social media posts: the date filter uses the scheduled publish time. Engagement figures such as likes and reach are not in this report.
- Appointments: No-show rate = no-shows ÷ (attended + no-shows); appointments without a marked status are left out.
- AI appointments → sales: The report opens with the All range (sales can come weeks after the appointment); other reports go back to Last 30 days. Sales conversion = won ÷ cards with appointment, using the card's current stage. Each card counts in one row, by its Booked by value in the Sales CRM (the same cards as the Booked by choice in the card filter); for older cards without that value, the appointment itself is used. Google Calendar entries are excluded. Earlier AI appointments are included too. If a card has no calendar entry, its appointment is counted from the card history: the appointment line in its history or the card being moved by a person or the AI to Randevu Alındı / Bugün Randevu (by the day it was booked; it is not counted as attended). The No appointment row shows cards with no appointment that closed (won or lost) in the selected range; the three rows add up to Total revenue.
- Memberships: status counts are as of today; the date filter applies only to the Started in period column.
- Cash flow projection: Collected in the previous 3 months leaves out the current month; this month is in Actual this month.
Hover over an Overview card to see its definition:
- Phone numbers captured: cards opened in the period that have a phone number. Not a contact count or the Number Captured column.
- Total appointments: calendar appointments by appointment date; cancelled ones are left out. The Today's appointments list comes from the same appointments, and "today" follows the workspace time zone (Business profile › General).
- Attended appointments: appointments marked Attended in the period.
- New memberships: memberships whose sale date is in the period; cancelled memberships are left out.
Cards follow what you sell: without Memberships / subscriptions in What do you sell?, New memberships is hidden; without Appointments, Total appointments and Attended appointments are hidden. The Records awaiting review box only shows when a Sales CRM column has the Manager review type, and lists opportunities the AI couldn't get a number for, waiting for your decision.
- Cancelled · refunds: the amount refunded in the period (as in Finance).
- In Recent sales, a cancelled or refunded sale shows a Cancelled · refunded or Cancelled · deposit kept badge; the collected column deducts the refund. The payment status is Unpaid when nothing has been collected, Partly paid when part has, and Paid in full when all of it has.
- The Today’s payments card lists payments entered today (in the workspace time zone) with customer, package, invoice type and amount; the day’s total is shown on top. A payment received today appears here even if the sale was made earlier. See all opens Finance on the Payments tab in Day view.
Using a report
- Choose a report from the list on the left.
- Set the date range and any other filters (sales flow, rep, channel).
- Results come as charts and tables; many reports compare with the previous period and show the change percentage.
Large ranges can take a moment; narrowing the range speeds it up. If a result came from the cache, press Refresh to update it. You can print a report or save it as PDF; the output carries the name and logo from your business profile.
Scheduled reports
To receive a report by email regularly, press Create scheduled report:
- Frequency: daily, weekly or monthly.
- Format and recipients (your teammates' emails).
In an agency client workspace, the email goes out under the client's name and doesn't show Talkty.
Pause, resume or delete scheduled reports from the list.